Integrals without the Math
Is it any wonder that so many people run scared from the concept of integrals and integration, when this is a typical definition?
What the!?!?
If you understood that you are a smarter person than me.
Here’s a plain English definition:
The integral of a signal is the sum of all the instantaneous values that the signal has been, from whenever you started counting until you stop counting.
So if you are to plot your signal on a trend and your signal is sampled every second, and let’s say you are measuring temperature. If you were to superimpose the integral of the signal over the first 5 seconds – it would look like this:

The green line is your temperature, the red circles are where your control system has sampled the temperature and the blue area is the integral of the temperature signal. It is the sum of the 5 temperature values over the time period that you are interested in. In numerical terms it is the sum of the areas of each of the blue rectangles:
p(13 x 1)+(14x1)+(13x1)+(12x1)+(11x1) = 63 °C s
The curious units (degrees Celsius x seconds) are because we have to multiply a temperature by a time – but the units aren’t important.
As you can probably remember from school –the integral turns out to be the area under the curve. When we have real world systems, we actually get an approximation to the area under the curve, which as you can see from the diagram gets better, the faster we sample.
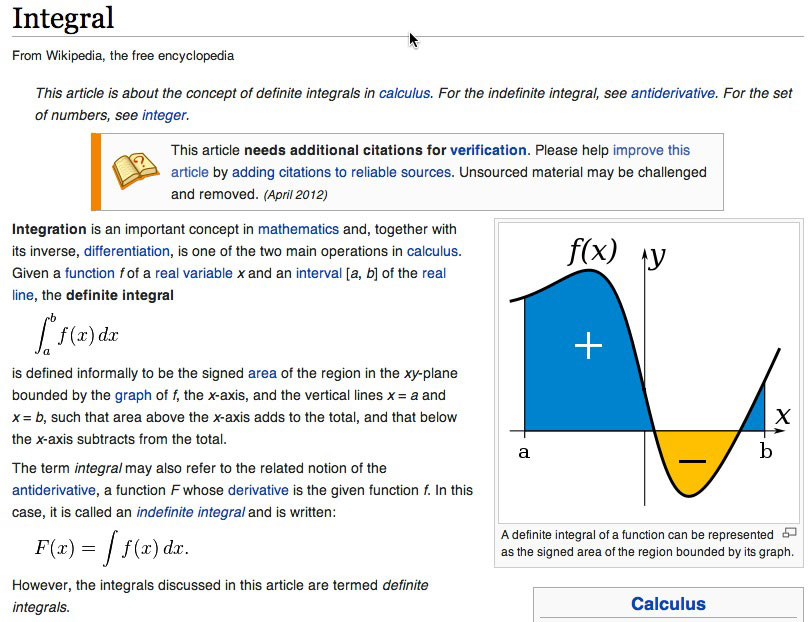
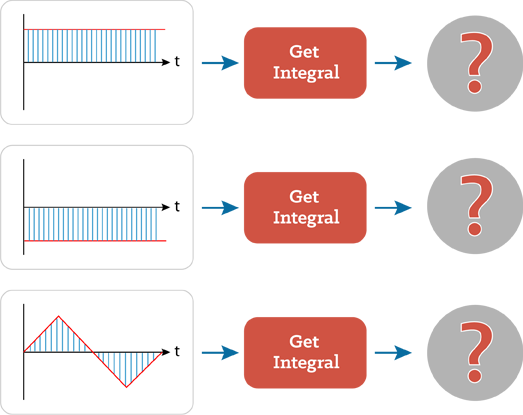
So let’s go back to our black boxes to check our intuitive understanding. This time we have boxes that take the input signal, calculate the integral, and output the value to a centre-zero meter.
What will the meters read for these 3 inputs?
Scroll Down for the answer...

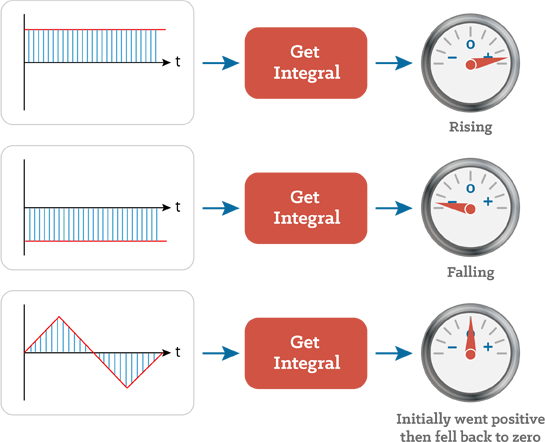
Were you correct? If not – remember that the meter will only be pointing to zero if the area under the signal is zero, or if the signal has covered exactly the same area above the x-axis as below it(because when it is below the x-axis the area counts as negative).
If the area under the signal is increasing – the meter will get more and more positive.
If the signal is only under the x-axis then the meter will get more and more negative as the signal clocks up more and more negative area.
Also if the signal is horizontal (i.e. constant) then the area is increasing at a uniform rate, so the output signal will do the same.
If the meter needle is stationary – all this tells us is that the input signal is at zero for that moment in time. If it is positive and stationary, then that tells us that it is zero at this moment, but in the past it must have been more positive than negative.
If you are happy with these concepts that you have all the understanding of Integral Calculus you need to understand how the PID algorithm works.
Tomorrow: Anatomy of a Feedback Control System
I'll Give You All The Tools And Training You Need To Tune Your PID Loop - From Just $97
Click Here to Order
“Its power and utility is embedded in its simplicity.
Your Blueprint launched our process from ‘expect the worst, but hope for the best’ process to one that is reliable and predictable. ”